Gif
Code - R
François Geerolf
load_data("eurostat/nama_10r_3empers.RData")
load_data("eurostat/wstatus.RData")
load_data("eurostat/nace_r2.RData")
load_data("eurostat/geo.RData")
load_data("maps/europe_NUTS0.RData")
load_data("maps/europe_NUTS1.RData")
load_data("maps/europe_NUTS2.RData")
load_data("maps/europe_NUTS2_2003.RData")
load_data("maps/europe_NUTS3.RData")
Unemployment Rates by County
options(gganimate.nframes = 50, gganimate.end_pause = 10)
county_long %>%
  filter(variable == "UNR", month(date) == 1, year(date) <= 2019, year(date) >= 2005) %>%
  {if (is_latex_output()) filter(., year(date) == 2007) else .} %>%
  mutate(value = value/100,
         year = year(date)) %>%
  select(county_code, year, value) %>%
  left_join(county_code_name %>%
              select(county_code, subregion = county_name3, region = state_name3),
            by = "county_code") %>%
  right_join(map_data("county"),
             by = c("region", "subregion")) %>%
  na.omit %>%
  ggplot(aes(long, lat, group = group)) +
  geom_polygon(aes(fill = value), colour = alpha("black", 1/2), size = 0.2)  +
  scale_fill_viridis_c(labels = scales::percent_format(accuracy = 1),
                       na.value = "white",
                       breaks = seq(0, 0.8, 0.1),
                       values = c(0, 0.1, 0.2, 0.3, 0.4, 0.5, 0.6, 0.7, 0.8, 1)) +
  theme_void() +
  theme(legend.position = c(0.9, 0.2)) +
  labs(fill = "Unemp.\nRate") +
  {if(!is_latex_output())transition_time(year)} +
  {if(!is_latex_output())labs(title = "Year: {frame_time}")}
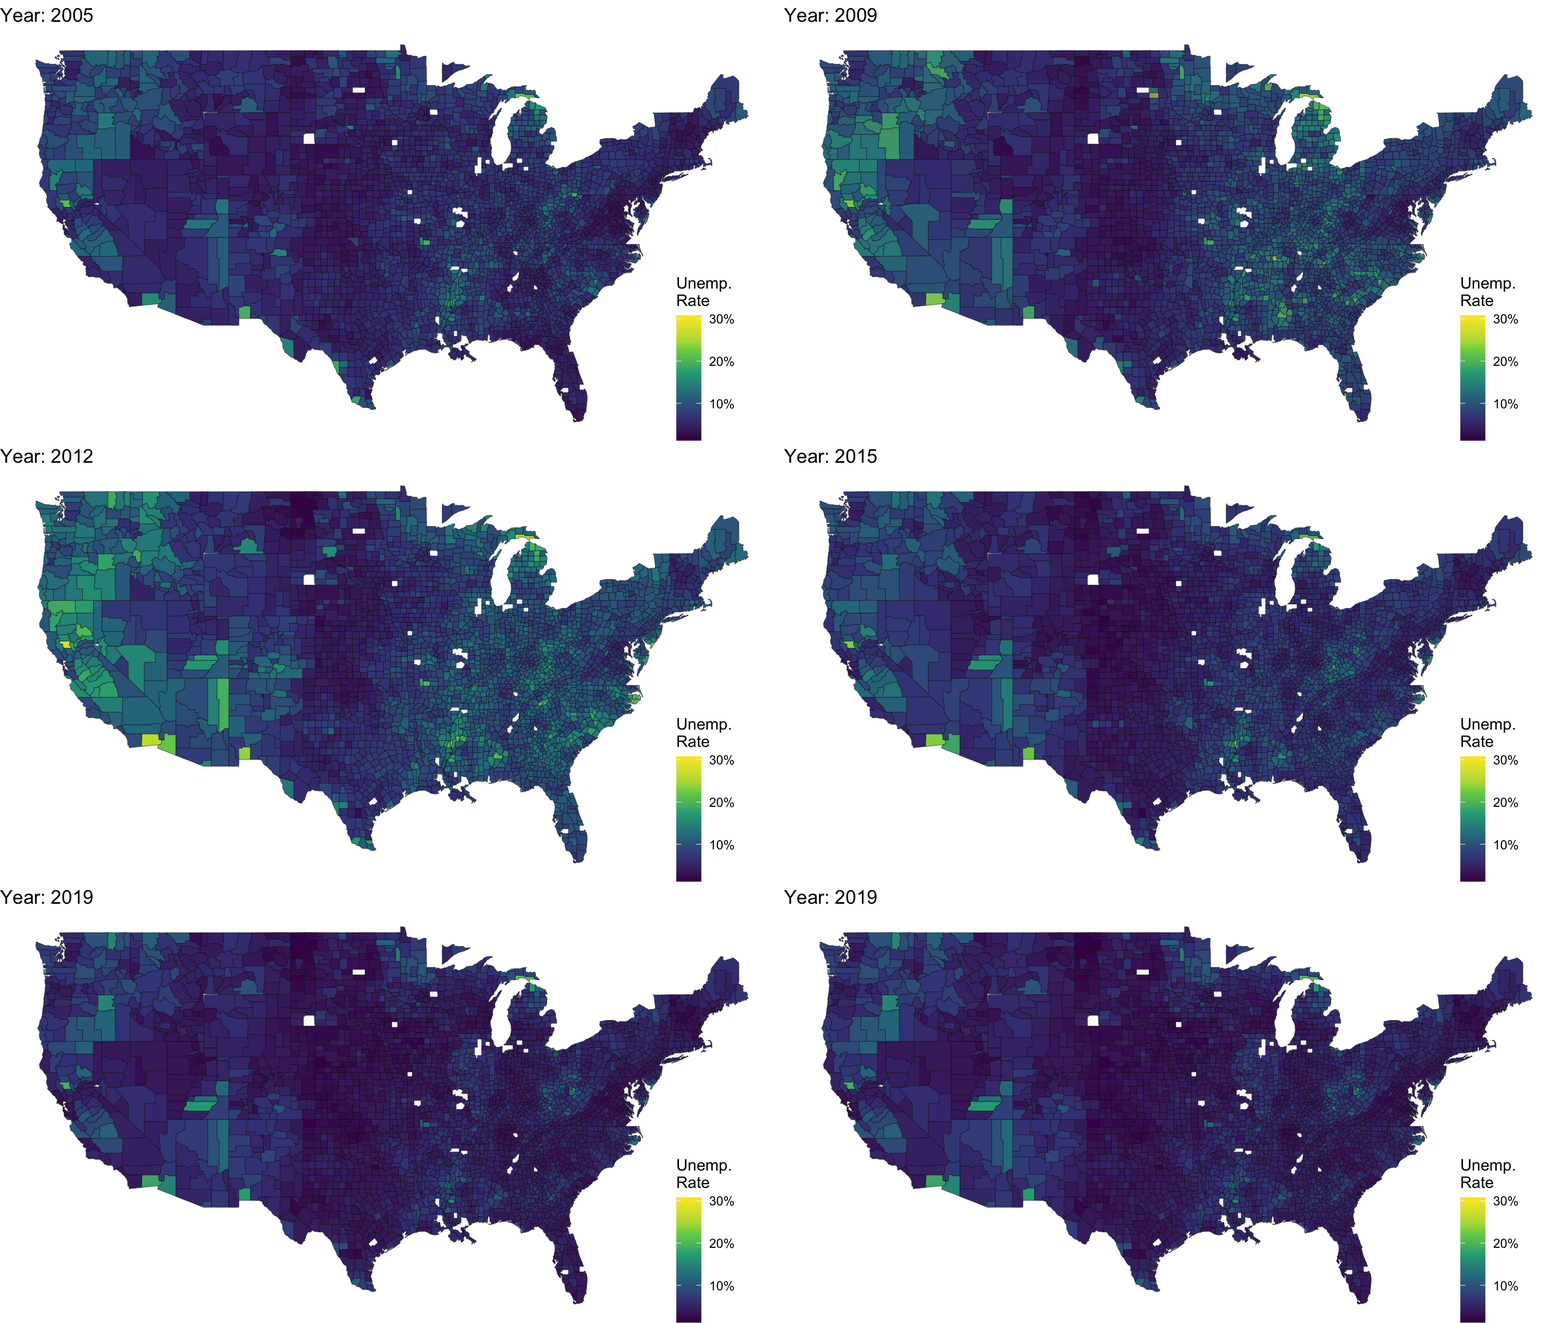
Figure 1: Unemployment Rates, by County
Unemployment Rates by County in California
county_long %>%
  filter(variable == "UNR", month(date) == 1) %>%
  {if (is_latex_output()) filter(., year(date) == 2007) else .} %>%
  mutate(value = value/100,
         year = year(date)) %>%
  select(county_code, year, value) %>%
  left_join(county_code_name %>%
              select(county_code, subregion = county_name3, region = state_name3),
            by = "county_code") %>%
  right_join(map_data("county") %>%
               filter(region == "california"),
             by = c("region", "subregion")) %>%
  ggplot(aes(long, lat, group = group)) +
  geom_polygon(aes(fill = value), colour = alpha("black", 1/2), size = 0.2)  +
  scale_fill_viridis_c(labels = scales::percent_format(accuracy = 1),
                       na.value = "white",
                       breaks = c(0, 0.05, 0.10, 0.15, 0.20, 0.25, 0.30, 0.35, 0.4),
                       values = c(0, 0.1, 0.2, 0.3, 0.4, 0.5, 0.6, 0.7, 0.8, 1)) +
  theme_void() +
  theme(legend.position = c(0.8, 0.8)) +
  labs(fill = "Unemp.\nRate") + coord_fixed(ratio = 1) +
  {if(!is_latex_output())transition_time(year)} +
  {if(!is_latex_output())labs(title = "Year: {frame_time}")}
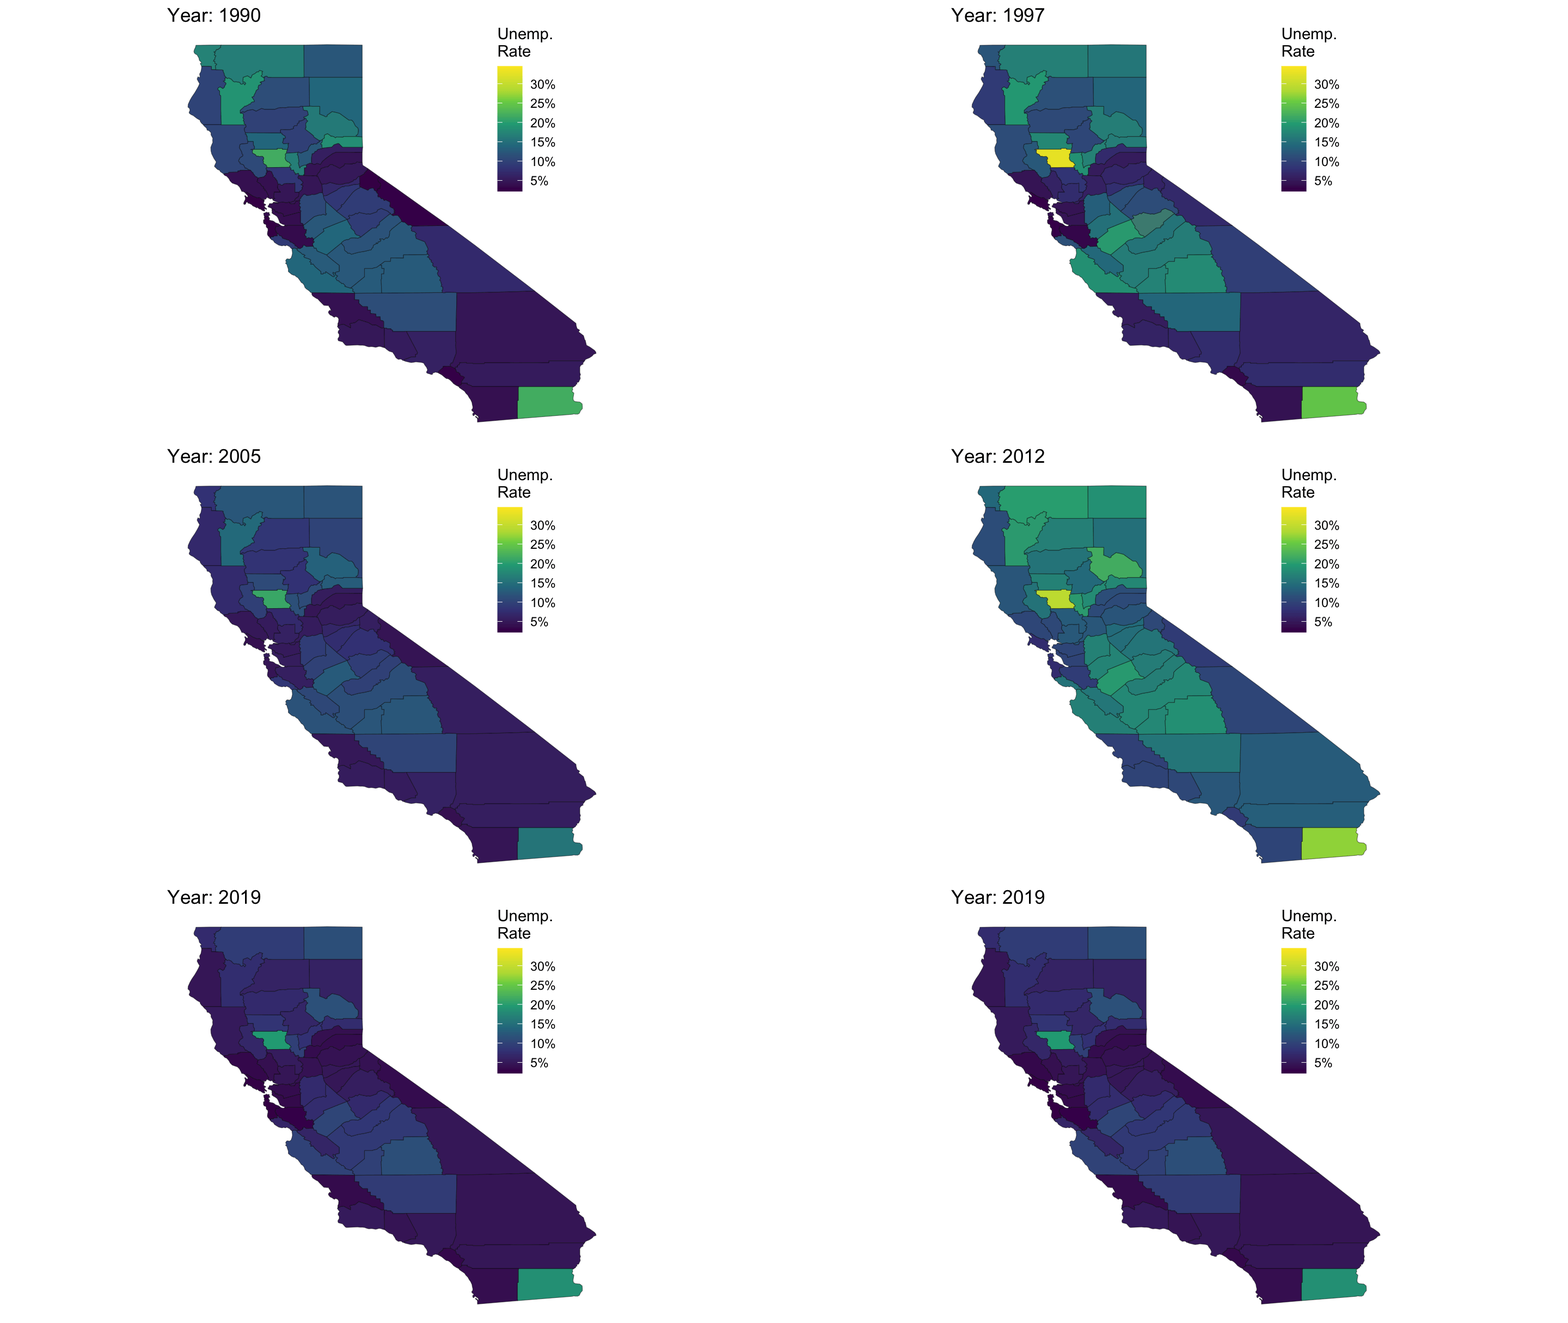
Figure 2: Unemployment Rates, by County
Time Series
fred %>%
  filter(series_id %in% c("FEDFUNDS", "INTDSREZQ193N")) %>%
  filter(date >= as.Date("1998-01-01")) %>%
  mutate(value = value/100,
         variable_desc = case_when(series_id == "INTDSREZQ193N" ~ "Euro Area Discount Rate",
                                 series_id == "FEDFUNDS" ~ "U.S. Fed Funds Rate")) %>%
  ggplot(.) + theme_minimal() +
  geom_line(aes(x = date, y = value, color = variable_desc)) +
  scale_color_manual(values = viridis(3)[1:2]) +
  geom_rect(data = nber_recessions,
            aes(xmin = Peak, xmax = Trough, ymin = -Inf, ymax = +Inf),
            fill = 'grey', alpha = 0.5) +
  scale_x_date(breaks = c(nber_recessions$Peak, nber_recessions$Trough, as.Date("2019-01-01")),
               labels = date_format("%y"),
               limits = c(as.Date("1999-01-01"), as.Date("2019-04-01"))) +
  scale_y_continuous(breaks = 0.01*seq(-50, 50, 1),
                     labels = scales::percent_format(accuracy = 1)) +
  theme(legend.position = c(0.8, 0.8),
        legend.title = element_blank()) +
  xlab("") + ylab("") +
{if(!is_latex_output())transition_reveal(date)} 
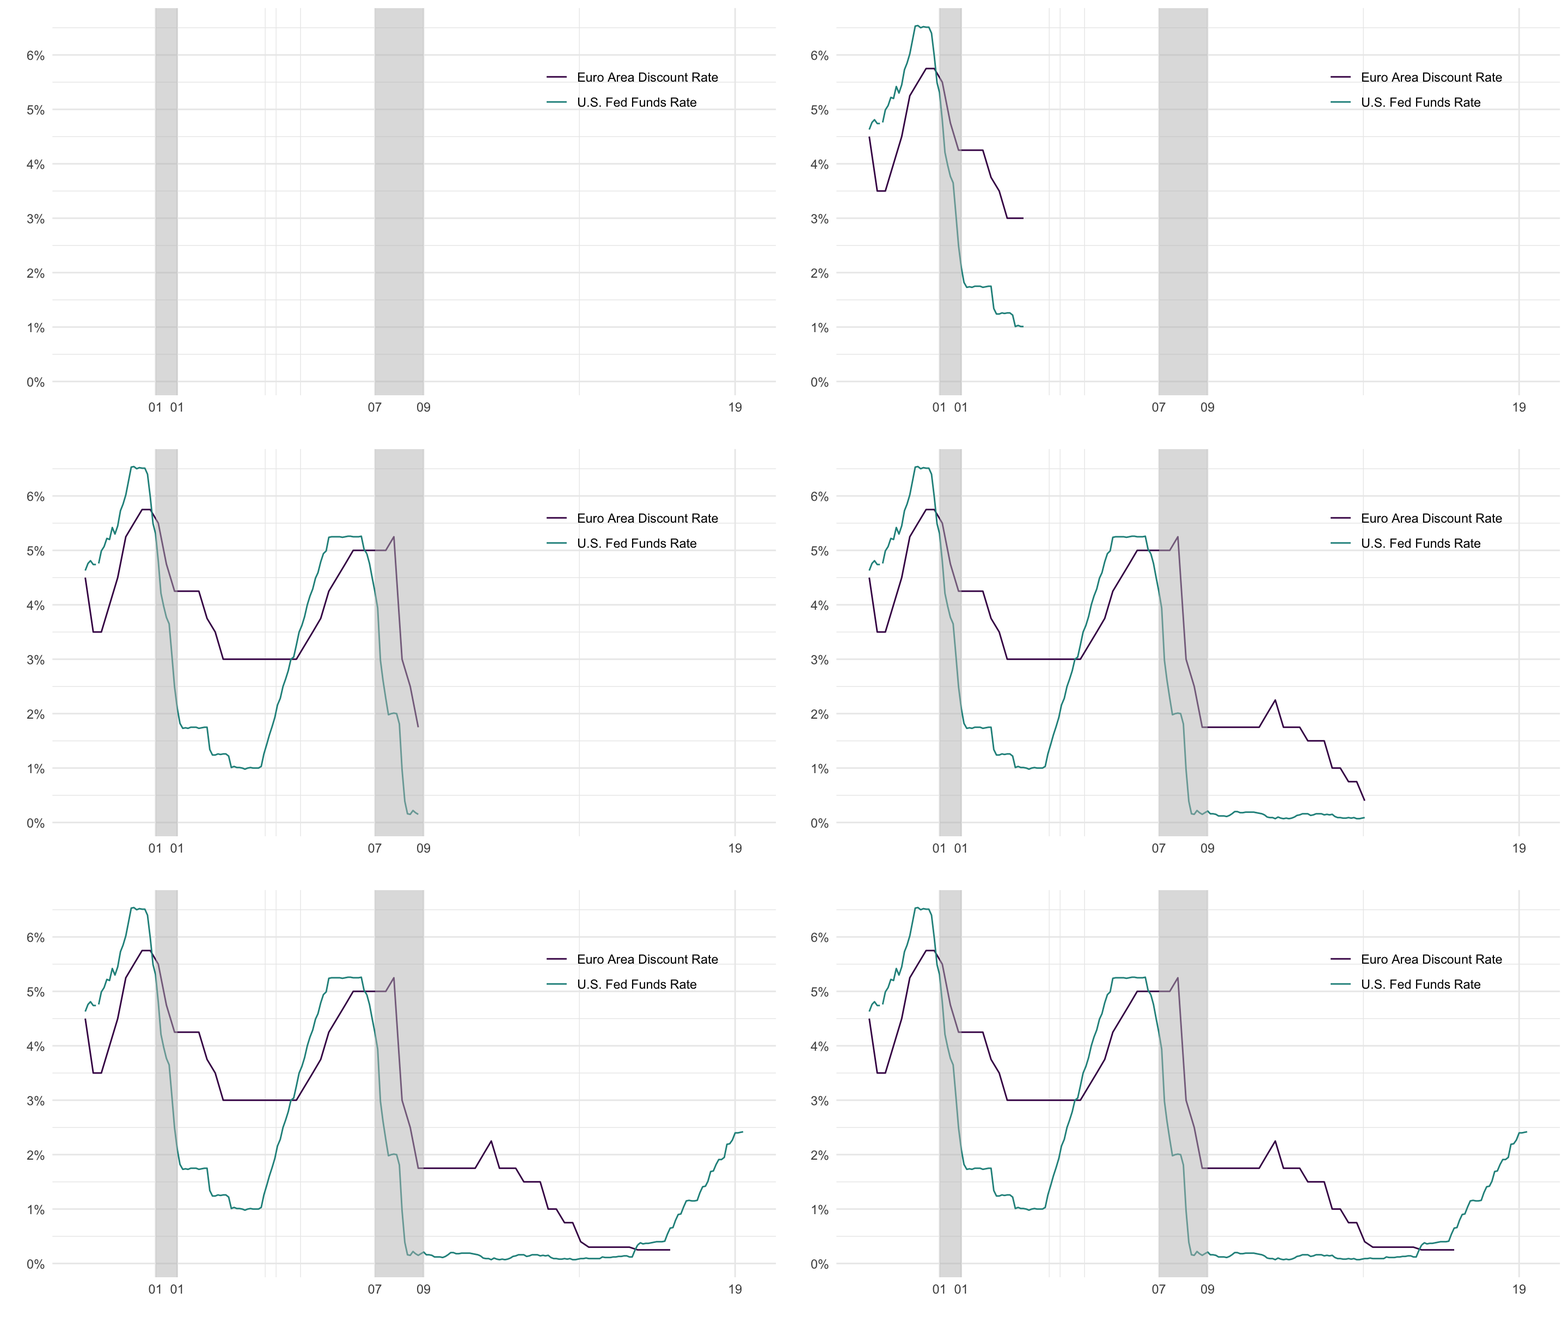
Figure 3: U.S. Versus Euro Area Discount Rates
options(gganimate.nframes = 50, gganimate.end_pause = 10)
nama_10r_3empers %>%
  filter(nchar(geo) == 4,
         wstatus == "EMP",
         nace_r2 %in% c("TOTAL", "A")) %>%
  left_join(geo, by = "geo") %>%
  spread(nace_r2, values) %>%
  mutate(`Share (%)` = round(100* `A` / TOTAL, 1),
         year = as.integer(time)) %>%
  filter(!is.na(year)) %>%
  select(year, geo, `Share (%)`) %>%
  right_join(europe_NUTS2, by = "geo") %>%
  filter(long >= -15, lat >= 33) %>%
  na.omit %>%
  ggplot(aes(x = long, y = lat, group = group)) +
  geom_polygon(aes(fill = `Share (%)`/100)) + coord_map() +
  scale_fill_viridis_c(na.value = "grey",
                       labels = scales::percent_format(accuracy = 1),
                       breaks = 0.01*seq(0, 50, 10),
                       values  = c(0, 0.1, 0.2,  1)) +
  theme_void() + theme(legend.position = c(0.25, 0.85)) +
  labs(fill = "Agriculture (%)") +
  transition_time(year) +
  labs(title = "Year: {frame_time}")