Colors
Code - R
François Geerolf
Viridis
Default
library(viridis)
library(scales)

nCol <- 25
myCol <- viridis(n = nCol)
#>  [1] "#440154FF" "#471164FF" "#481F70FF" "#472D7BFF" "#443A83FF"
#>  [6] "#404688FF" "#3B528BFF" "#365D8DFF" "#31688EFF" "#2C728EFF"
#> [11] "#287C8EFF" "#24868EFF" "#21908CFF" "#1F9A8AFF" "#20A486FF"
#> [16] "#27AD81FF" "#35B779FF" "#47C16EFF" "#5DC863FF" "#75D054FF"
#> [21] "#8FD744FF" "#AADC32FF" "#C7E020FF" "#E3E418FF" "#FDE725FF"
show_col(myCol)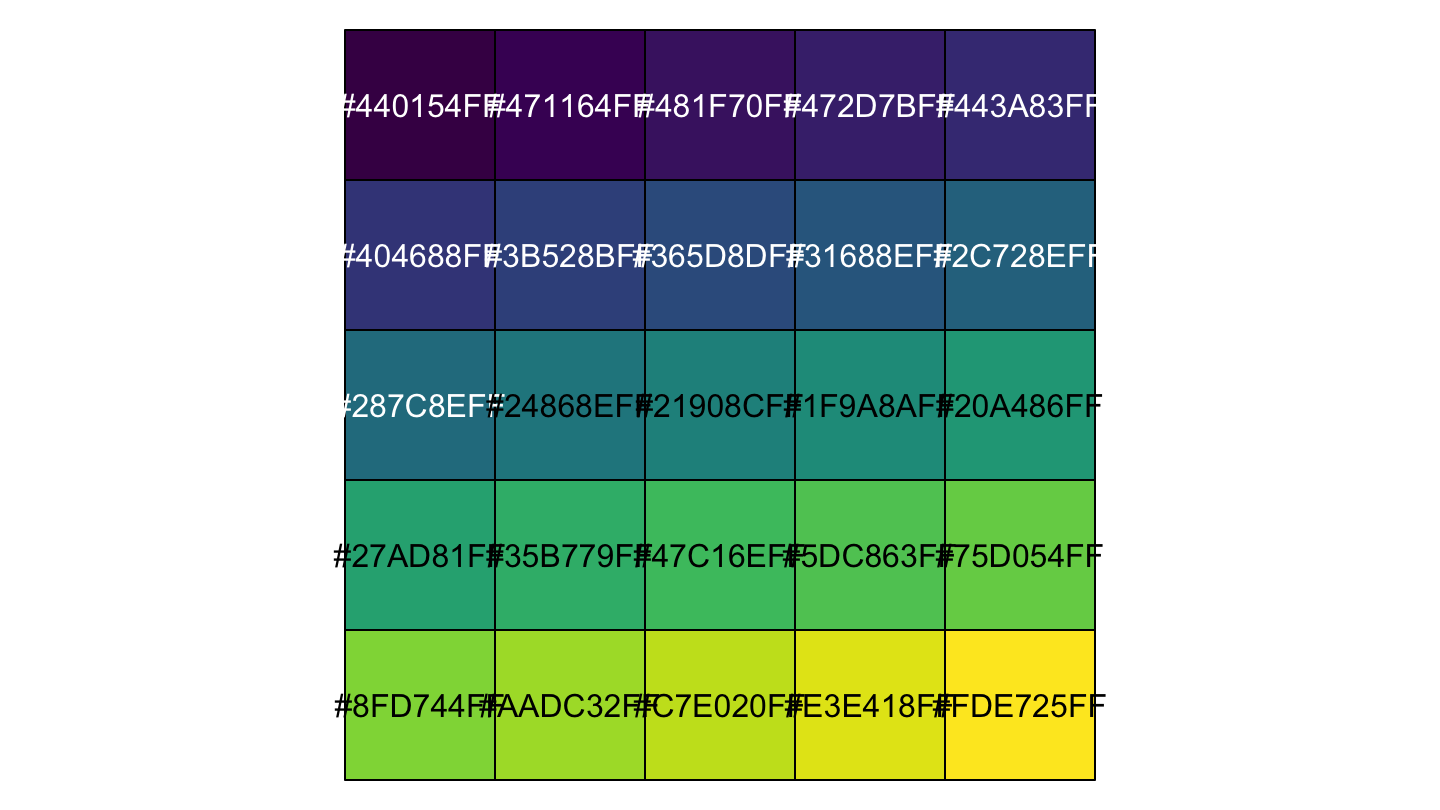
Option = E
library(viridis)
library(scales)

myCol <- viridis(n = nCol, option = "E")
show_col(myCol)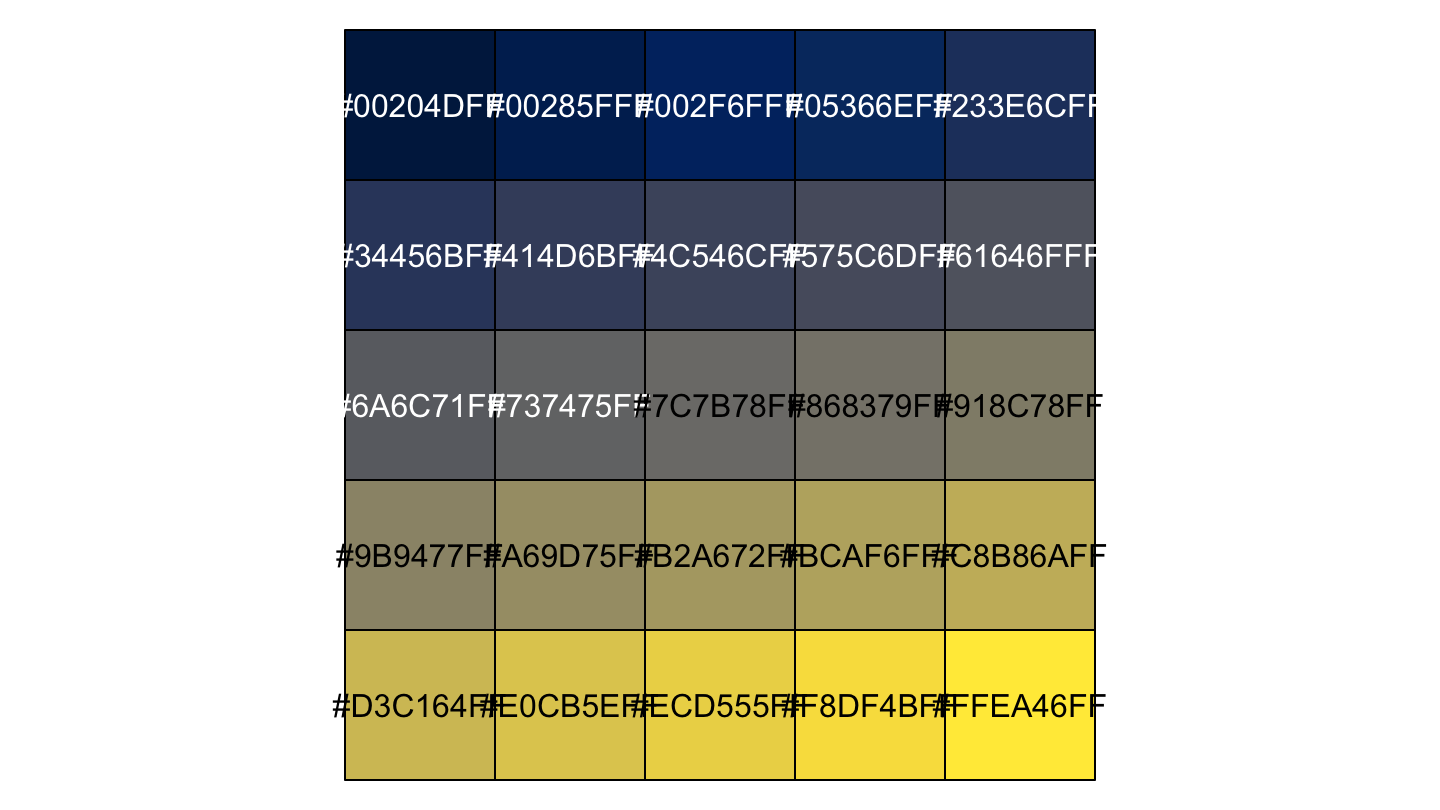
Option = B
myCol <- viridis(n = nCol, option = "B" )
pie(rep(1, nCol), col = myCol, labels = myCol)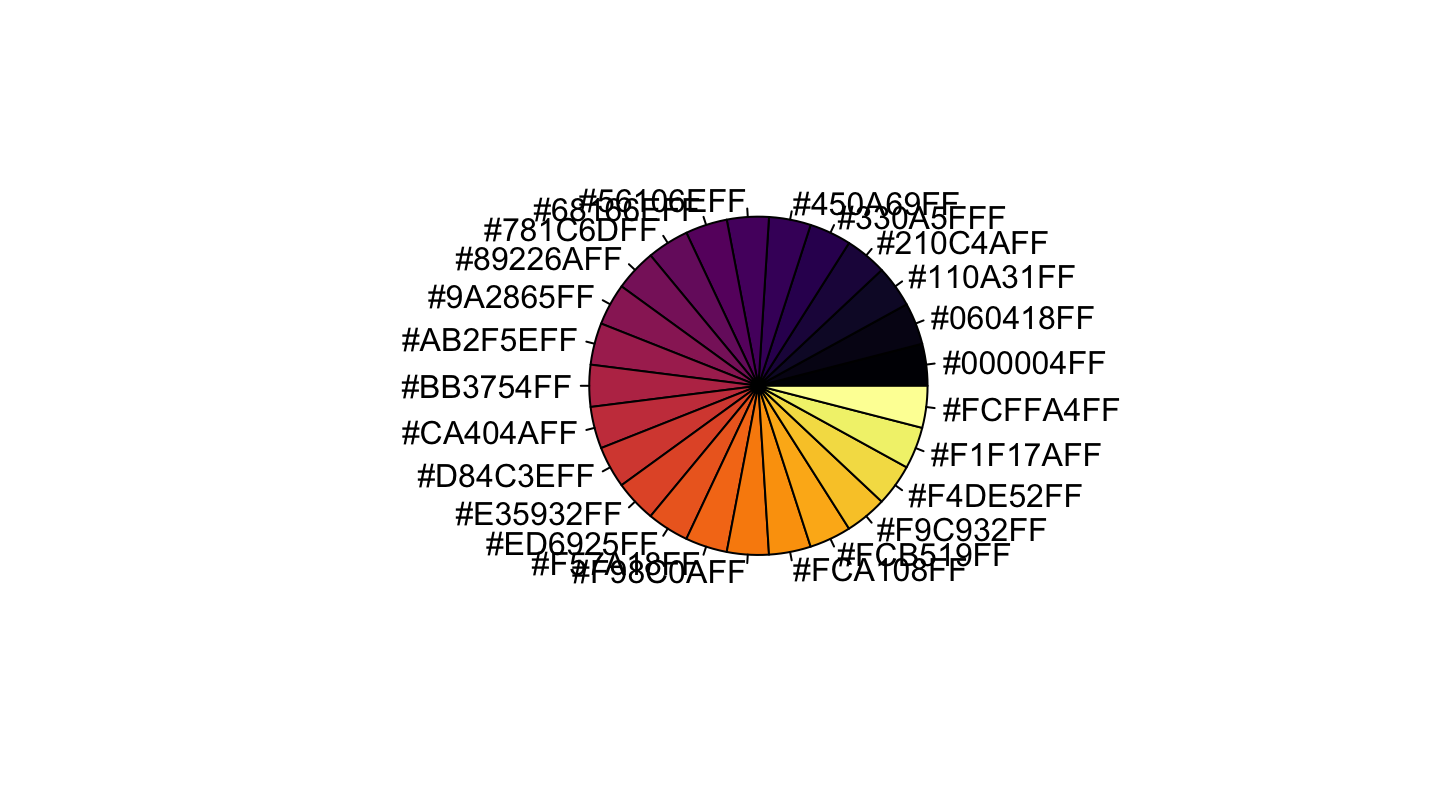
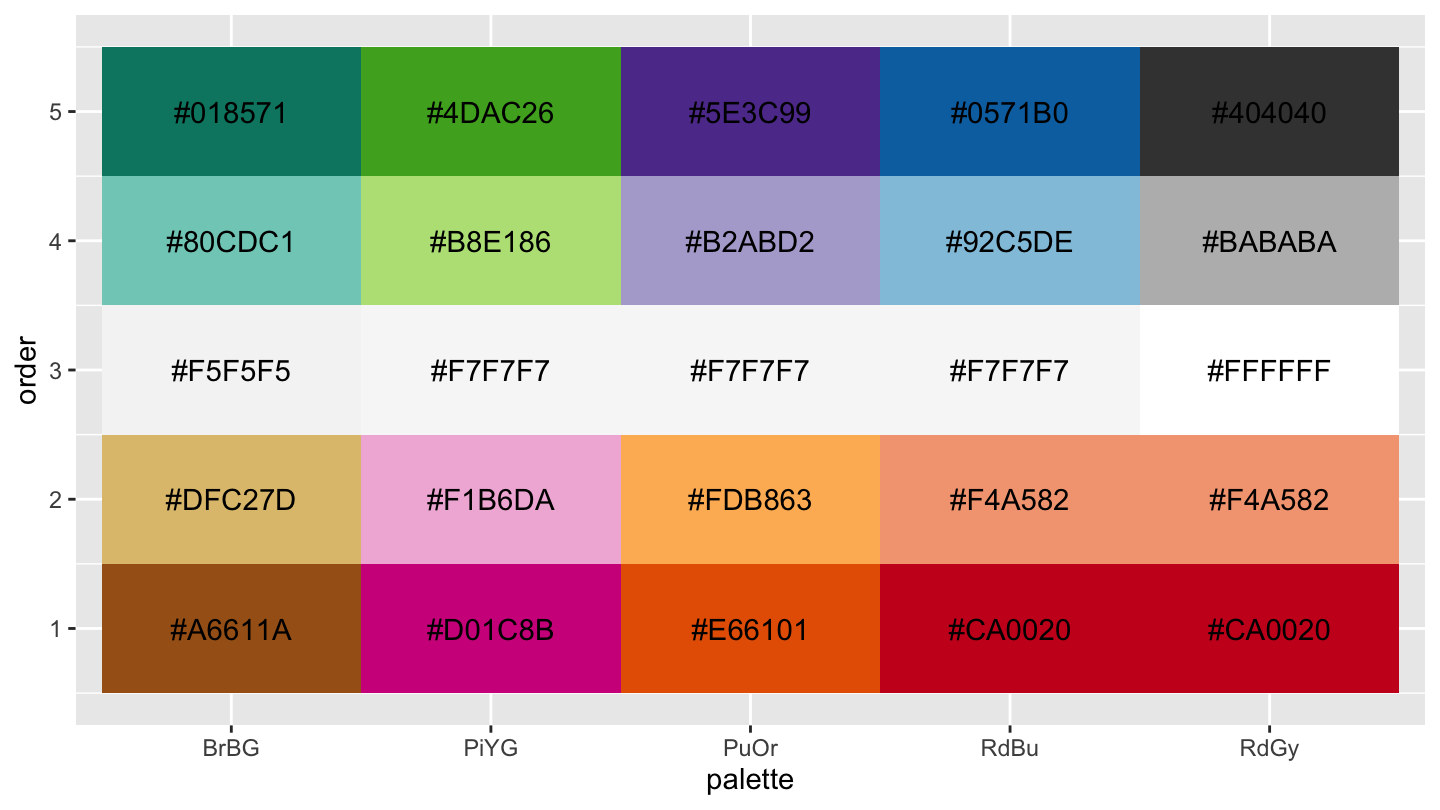
Example
library(RColorBrewer)
library(tidyverse)
library(foreach)
library(reshape2)

# Matrix of colors ----
# specify
palettes <- c("BrBG", "PiYG", "PuOr", "RdBu", "RdGy")
n_colors <- 5

# take colors, name the column, then cbind
color_mat <- foreach(p = palettes, .combine = "cbind") %do% {
  tibble(!!p := brewer.pal(n_colors, p))
}


# Plotting -----
# reshape for plotting:
color_df <- mutate(color_mat, order = 1:n())
long_color <- melt(color_df,
                   id.vars = "order",
                   variable.name = "palette",
                   value.name = "color")


# plot it, using scale_color_identity to interpret the hex as a color
ggplot(long_color, aes(x = palette, y = order, fill = color)) +
  geom_tile() +
  geom_text(aes(label = color)) +
  scale_fill_identity()